
|
Representing data in a pie chart can help make an infographic look engaging, just as long as it's not a normal (boring) pie chart. Adding color, shading and interest helps tell a more interesting story. 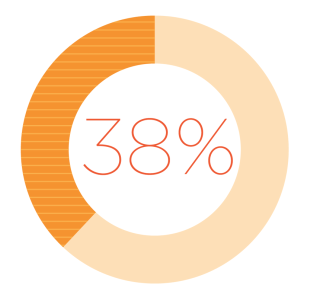 Start with a drawing a circle. Hold SHIFT to create a perfect circle. Keep the fill off, add a stroke and set the point size (in this case it's 40 pt stroke) 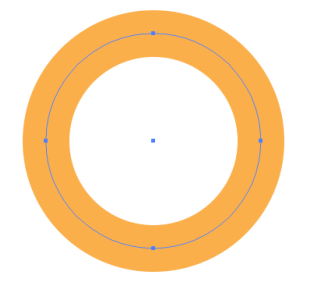 Outline the Path to convert the path to a shape. Object > Path > Outline Stroke. 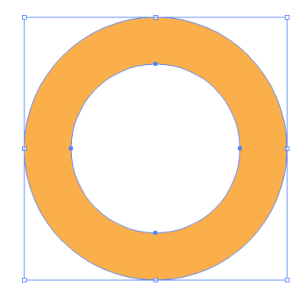 Draw a line from the center of the circle, hold the SHIFT down to create a vertical line. Draw the line beyond the outside edge and add a 1pt stroke to the line. Color of the stroke is not important as the line will go away... in a few steps. 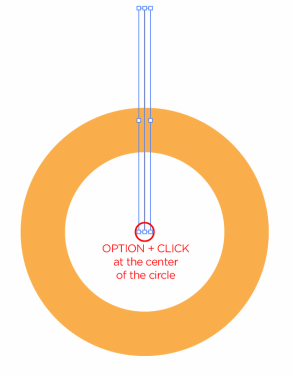 Select the vertical line, then select the Rotate Tool (R) and bring the cursor to the center of the circle, hold OPTION and click in the exact center of the circle. OPTION brings up the Rotate Dialog box, click relocates the reference point at which the rotate command will rotate around. With the rotate dialog box, you can convert a PERCENTAGE to degrees in a circle. 1% = 3.6° of rotation. Instead of using a calculator, you can do the calculations IN the field as shown below.\ In this case, I am using 38% and multiplying it by 3.6 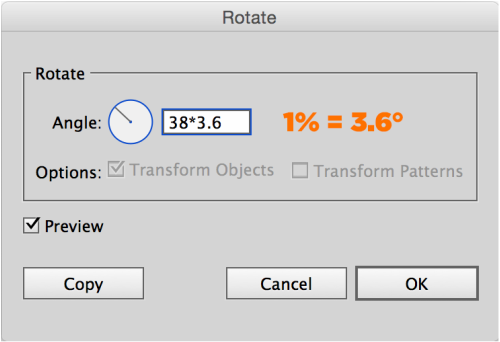 DON'T CLICK OK, you want to click copy instead. The calculation in the field will then rotate the line but you want to COPY the line to keep the original vertical line and get the second line rotated to the new angle that is calculated. 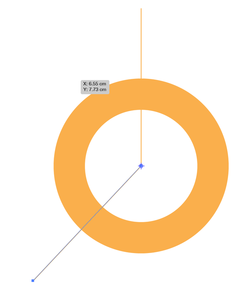 Select both lines and the circle. Using the Divide the action in the Pathfinder Panel, this will divide the circle at the line intersections. Then Ungroup the resulting shape (Object > Ungroup) 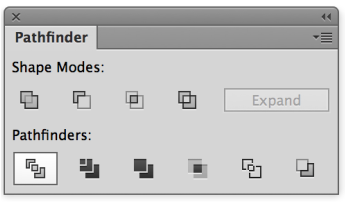 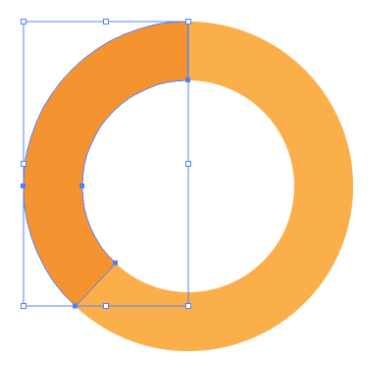 Select one section of the newly divided circle and change the color. To add additional shading to the section, select the section of the circle and then choose the Draw Inside function at the bottom of the Tool Bar. 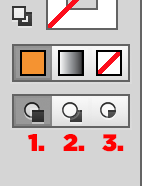 1. Normal Drawing Mode: This is what is selected by default. This allows everything to be drawn in front of other elements. 2. Draw Behind Mode: Draws everything behind the current objects. 3. Draw Inside Mode: This is the easy way to do a clipping mask. Everything that is drawn in the mode is drawn INSIDE the selected element. 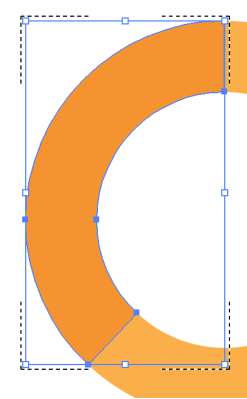 When the Draw Inside Mode is selected after the shape is selected, you will see a "clipping" line around the object. Everything that is drawn goes INSIDE this selected shape until the mode is changed to Normal Drawing Mode by clicking on the appropriate button at the bottom of the Tool Bar. 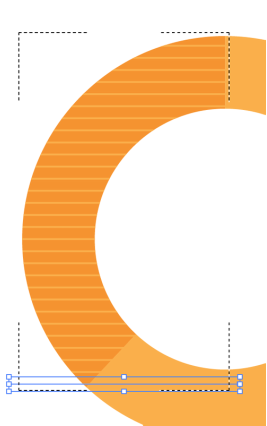 Draw a line, hold down the SHIFT key to make it straight. Choose a stroke weight that works well and choose a color that offers come contrast with the fill color of the object. To duplicate the first line, hold OPTION + SHIFT and drag the line and position it with the appropriate spacing. Then use COMMAND + D to duplicate it repeatedly to fill the shape. 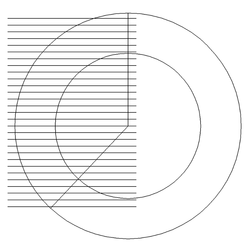 In Preview Mode (COMMAND + Y) you can see the lines that were created and duplicated in the shape area. Once you get out of Preview Mode (COMMAND + Y) the lines will be masked or "clipped" by the shape. Make SURE you click back on the Normal Draw Mode at the bottom of the tool bar or everything you draw will be INSIDE the shape!! 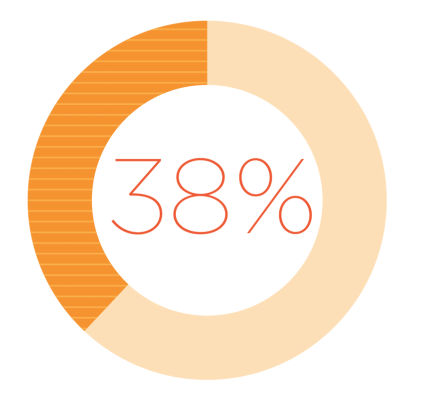 Add some type to the shape and you have a great way to show a percentage. And a creative way to represent a boring pie chart in an interesting way!
0 Comments
Leave a Reply. |
Archives
March 2021
|
 RSS Feed